DaViS underwater acoustic DAta VIsualisation Software

Dynamic visualization replay software
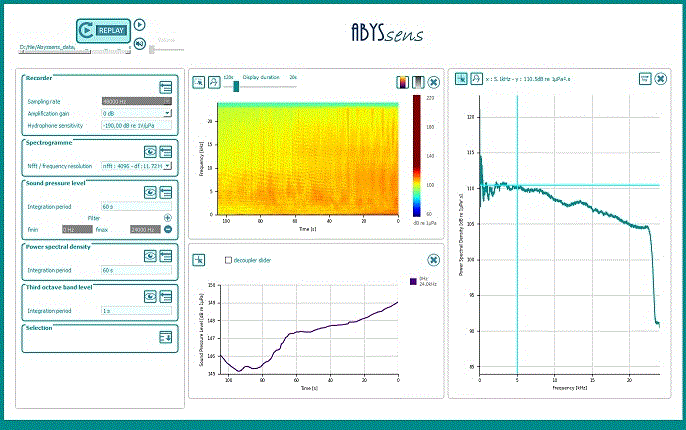
A post treatment dynamic visualization of the data is possible with the dedicated software: DaViS. It performs acoustics analysis in replay mode from .wav file of your DORI underwater acoustic recorder.
DaViS displays :
- the spectrogram,
- the temporal evolution of Sound Pressure Level (SPL),
- the Power Spectral Density
- the third octave band levels.
In addition, this software allows an audio listening.
Key specifications of our underwater acoustic data display software DaViS
✓ Gain and sensitivity of hydrophone are automatically filled
✓ Acoustic levels directly in dB re 1µPa
✓ Modular display and user friendly
✓ Free of charge – included with recorders
Details on technical specifications of our software
Modular display
The table below shows the selectable displays and interactive tools that can be selected for each chart.
| Spectrogram | PSD |
SPL | 1/3 octave | |
| Configuration | ||||
| NFFT (or frequency resolution) | ✓ | ✓ | ||
| Integration time | ✓ | ✓ | ✓ | |
| Frequency band | 3 bands | ✓ | ||
| Tools | ||||
| Zoom | ✓ | ✓ | ✓ | ✓ |
| Pointer with value displayed | ✓ | ✓ | ✓ | ✓ |
| Logarithmic / linear frequency scale | ✓ | |||
| Display duration | ✓ | ✓ | ||
| Color bar choice |
✓ | |||
| Area of interest selection |
✓ | |||
Area of interest selection
The selection of a time interval of interest can be made by selecting directly in the spectrogram. Next, another section appears with final acoustic information about this selected interval: a zoom of the spectrogram, power spectral density, third octave band level and SPL values are shown while real time values are still displayed on the main graphs.
Method
The spectrogram corresponds to a time-frequency display. Underwater acoustic levels are expressed in dB re 1µPa (reference in underwater acoustics) and are estimated using the following standards:
- The ISO, 2017 standards (present on Magnier et al. 2020) for the Sound Pressure Level SPL.
- The ANSI/ASA S1.11-2014 standards for the levels of third octave bands.
